20454+5735 CIA 1 Aa,Ab
20h 45m 21.12s +57° 34' 47.0" P.A. 105.00 sep 0.1 mag 5.20,5.50 Sp F8IV-V+F9 dist. 27.29 pc (89.02 l.y.)
| Coord 2000 |
20454+5735 |
|
Discov num |
CIA 1 |
|
Comp |
Aa,Ab |
|
Coord arcsec 2000 |
20 45 21.12 +57 34 47.0 |
|
| Date first |
2006 |
|
Date last |
2010 |
|
Obs |
19 |
|
| Pa first |
92 |
|
Pa last |
104.9 |
|
P.A. Now (θ) |
104.9° |
|
| Sep first |
0.0 |
|
Sep last |
0.055 |
|
Sep. Now (ρ) |
0.055" |
|
| Mag pri |
5.20 |
|
Mag sec |
5.50 |
|
delta mag (ΔM) |
0.3 |
|
Spectral class |
F8IV-V+F9 (yellow-white) |
|
| Pri motion ra |
-062 |
|
Sec motion ra |
|
|
| Pri motion dec |
-236 |
|
Sec motion dec |
|
|
| Notes |
N
O
(See Notes, Orbital solution) |
|
This double is physical.
20454+5735 SYSTEM COMPONENTS
| Show |
name |
SAO |
coord |
wds_name |
last |
obs |
pa |
sep |
mag1 |
mag2 |
d_mag |
orb |
current |
| Show |
|
32862 |
20 45 21 +57 34 47 |
CIA 1 Aa,Ab |
2010 |
19 |
105 |
0.1 |
5.20 |
5.50 |
0.30 |
Y |
<=== |
| Show |
Ups1 Cep |
32862 |
20 45 21 +57 34 47 |
ENG 76 AB |
2004 |
17 |
146 |
48.4 |
4.57 |
9.86 |
5.29 |
|
|
Triple system
2 estimated visually detectable stars in this system
OTHER CATALOGS AND DESIGNATIONS
| Constellation |
Cepheus |
|
SAO |
32862 |
|
HIP |
102431 |
|
Tycho2 |
3959-01685-1 |
|
| Gaia DR2 |
2190258605988673536 |
|
HD |
198084 |
|
HR |
7955 |
|
GC |
28956 |
|
| GL |
Wo 9706 |
|
BD |
BD+57 2240 |
|
Bayer |
Upsilon 1 Cephei |
|
Bayer name |
Ups1 Cep |
|
| FK5 |
782 |
|
Distance |
27.29 |
|
Distance ly |
89.02 |
|
Bayer greek |
υ1 Cep |
|
ORBITAL ELEMENTS
| Period (P) | 523.4192d | ± 0.101 |
Periastron (T) | 50206.004m (1996.337y) | ± 0.609 |
Semi-major axis (a) | 0.065a | ± 0.001 |
| Eccentricity (e) | 0.551 | ± 0.004 |
Inclination (i) | 24.53° | ± 3.13 |
Longitude of periastron (ω) | 68.86° | ± 0.76 |
| Node (Ω) | 325.21° | ± 1.05 |
Notes | n | |
Reference | CIA2010 | |
| Equinox | | |
Last observation | 2009 | |
Grade | 2 | (1=Definitive, 9=Indet.) |
| label |
theta |
rho |
| 2000-01-01 |
219.8 |
0.091 |
| 2001-01-01 |
176.4 |
0.080 |
| 2002-01-01 |
331.3 |
0.036 |
| 2003-01-01 |
233.4 |
0.086 |
| 2004-01-01 |
191.4 |
0.089 |
| 2005-01-01 |
95.6 |
0.033 |
| 2006-01-01 |
249.9 |
0.076 |
| 2007-01-01 |
204.3 |
0.093 |
| 2008-01-01 |
149.3 |
0.059 |
| 2009-01-01 |
272.8 |
0.061 |
| 2010-01-01 |
216.8 |
0.092 |
| 2011-01-01 |
172.3 |
0.077 |
| 2012-01-01 |
314.3 |
0.041 |
| 2013-01-01 |
230.1 |
0.087 |
| 2014-01-01 |
188.1 |
0.088 |
| 2015-01-01 |
68.2 |
0.028 |
| 2016-01-01 |
245.6 |
0.079 |
| 2017-01-01 |
201.3 |
0.092 |
| 2018-01-01 |
141.3 |
0.054 |
| 2019-01-01 |
266.5 |
0.065 |
| 2020-01-01 |
213.8 |
0.093 |
| 2021-01-01 |
167.9 |
0.074 |
| 2022-01-01 |
301.2 |
0.047 |
| 2023-01-01 |
226.8 |
0.089 |
| 2024-01-01 |
184.7 |
0.086 |
| 2025-01-01 |
33.9 |
0.027 |
| 2026-01-01 |
241.6 |
0.081 |
| 2027-01-01 |
198.3 |
0.092 |
| 2028-01-01 |
131.5 |
0.048 |
| 2029-01-01 |
260.8 |
0.069 |
| 2030-01-01 |
210.9 |
0.093 |
|
|

Note: Theta is PA, Rho is Sep. For yearly orbits, data refer to Jan 1st.
|
|
|
|
|
|
|
|
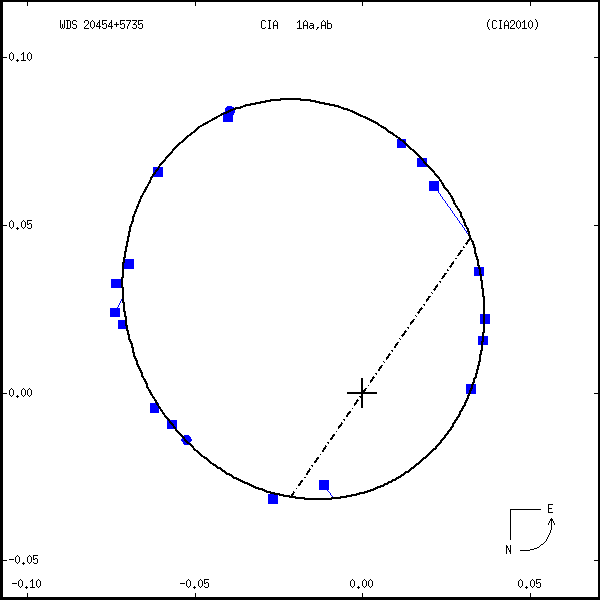
Measures: green=micrometric, blue=interferometric, purple=photographic |
|